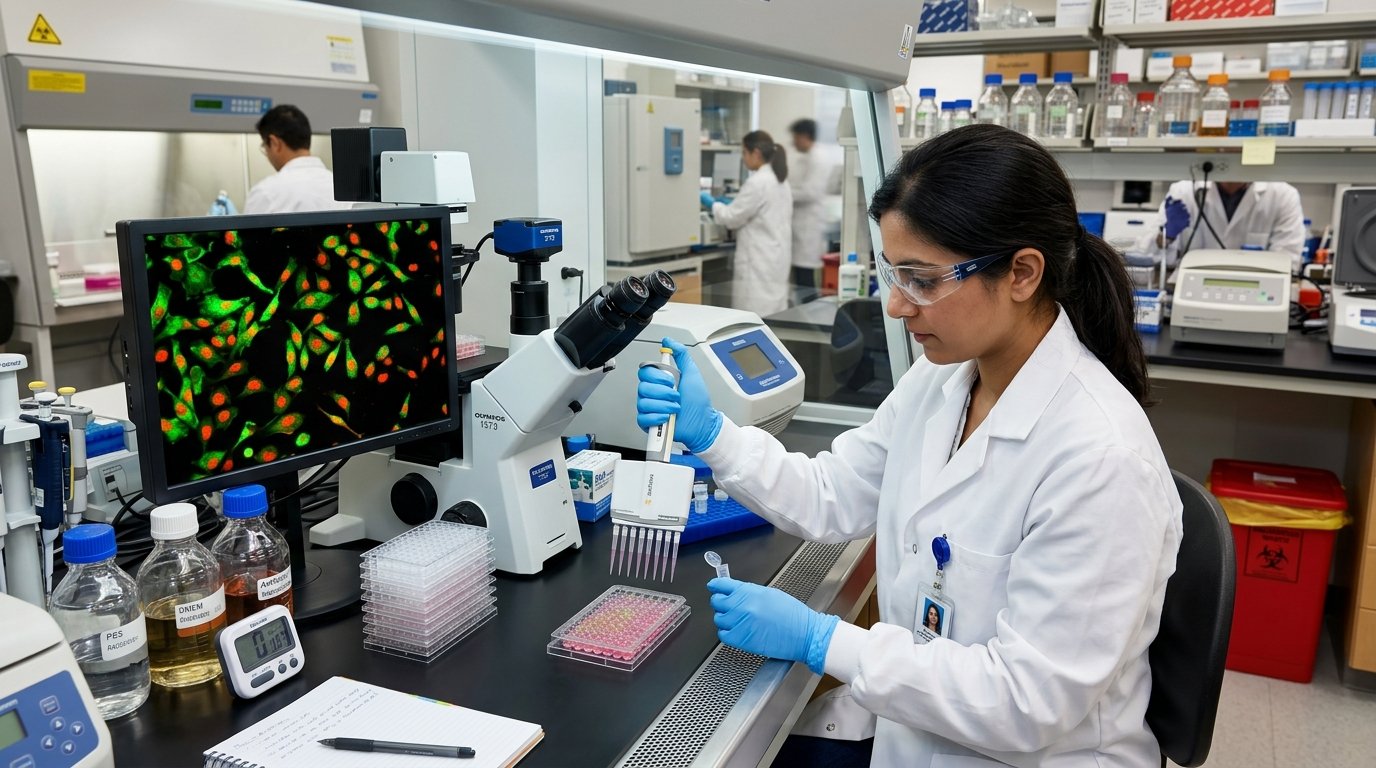
Comprehensive quantification of disease-relevant protein biomarkers including inflammatory cytokines, oxidative stress markers, apoptotic signaling proteins, hepatic and renal function panels, and hormone/metabolite assays — providing mechanistic biological evidence supporting pharmacological and translational research.
Biomarker analysis enables quantitative assessment of molecular-level responses to drug treatment, disease progression, or cellular stress. From tissue-level oxidative status to circulating inflammatory cytokines and apoptotic protein expression, our immunology and molecular biology team applies validated ELISA, spectrophotometric, and Western blot methodologies to provide mechanistic depth to preclinical and cell biology studies.
Immunology & Western Blot SuiteQuantification of pro-inflammatory and anti-inflammatory cytokines from serum, plasma, cell culture supernatant, or tissue homogenate using validated sandwich ELISA kits. Cytokine panel includes: TNF-α (Tumor Necrosis Factor-alpha), IL-6 (Interleukin-6), IL-1β, IL-10, IL-2, IFN-γ, MCP-1. Plate reader absorbance at 450 nm; 4-parameter logistic (4-PL) curve fitting for quantification. Results expressed as pg/mL or ng/mL. Minimum detectable concentration per cytokine: typically < 1–10 pg/mL.
Colorimetric enzyme kinetic assays for antioxidant and oxidative stress evaluation in tissue homogenates, serum, and cell lysates:
MDA (Malondialdehyde): TBARS (thiobarbituric acid reactive substances) assay — lipid peroxidation marker.
SOD (Superoxide Dismutase): Inhibition of NBT photoreduction assay (expressed as U/mg protein).
CAT (Catalase): H₂O₂ decomposition rate assay at 240 nm.
GSH (Reduced Glutathione): DTNB (Ellman's reagent) colorimetric assay at 412 nm.
LPO (Lipid Peroxidation): Ferrous oxidation-xylenol orange (FOX) method.
Automated and colorimetric determination of organ function biomarkers from serum/plasma:
Liver Function: SGOT/AST, SGPT/ALT, ALP, GGTP, Total Bilirubin, Direct Bilirubin, Albumin, Total Protein.
Kidney Function: Serum Creatinine, Blood Urea Nitrogen (BUN), Uric Acid, Urinary Creatinine, Urinary Protein.
Lipid Profile: Total Cholesterol (TC), Triglycerides (TG), HDL-C, LDL-C, VLDL-C, Atherogenic Index.
Metabolic Panel: Fasting Blood Glucose, HbA1c, Insulin, Glycogen content (liver).
SDS-PAGE (8–15% polyacrylamide gels, depending on target protein size) followed by electrophoretic transfer to PVDF or nitrocellulose membrane. Membrane blocked with 5% BSA or non-fat dry milk. Primary antibody incubation (anti-Bcl-2, anti-Bax, anti-p53, anti-NF-κB, anti-caspase-3, anti-GAPDH). HRP-conjugated secondary antibody detection. Band visualization using ECL chemiluminescence substrate. Densitometric band quantification using ImageJ software normalized to loading control (β-actin/GAPDH).
Total protein quantification of tissue homogenates and cell lysates using Bradford (Coomassie Brilliant Blue G-250) and Lowry (Folin-Ciocalteu) methods. BSA standard curve for normalization. Tissue homogenization in appropriate buffer (RIPA, phosphate buffer, HEPES) using mechanical homogenizer followed by centrifugation (10,000 × g, 15 min, 4°C) to obtain post-mitochondrial supernatant for enzyme assays.
Blood collected and centrifuged (3000 rpm, 15 min) for serum isolation. Tissues weighed and homogenized in cold buffer. Aliquots prepared and stored at -20°C until analysis.
Protein concentration of all homogenates determined by Bradford/Lowry method. Enzyme activities expressed per mg protein.
ELISA kits run per manufacturer protocol with all calibrators and controls included. Enzyme assays run in duplicate/triplicate.
SDS-PAGE run, transfer, blocking, antibody incubation, and ECL detection completed. Gel image captured by gel documentation system.
All values expressed as Mean ± SEM. ANOVA + Dunnett's test. Data tables, bar graphs (GraphPad Prism), and Western blot band images compiled in report.
Specify your panel and sample details
Our biomarker team is available to design the right assay panel for your study.